A pretty Chicago CTA Train Display
Creating a beautiful PCB representation of the CTA line in Chicago. Featuring lots of LEDs and a unique acrylic backing!

Months ago I came across this project: Traintrackr. It gives you a live view of where the trains are arriving in each station.
I made one for Chicago.
Tldr; I made a pretty thing that isn't (really) IoT but involves trains and many LEDs.
Tracking methods
Live
To track the trains live, you would need access to CTA's API, which only requires you to sign up.
It is well documented. And I experimented with it for awhile, but ultimately I did not go down this route of displaying the trains.
Scheduled
Displaying trains based on a schedule is less exciting but it does confer some benefits:
- No need to provision an API. This is an important fact because it is difficult for the API server to be online forever, and for a project to stop working because the server is not online is not a good failure point. The CTA API might also be taken down at some point.
- Needs a WiFi access point. The WiFi access might be spotty or otherwise unavailable. A means to update or store the password must also be available through other means.
I felt that among the two, displaying the trains on schedule is more important than the live method because it has less failure modes. More importantly, considering that the project is more of an art project than an attempt to accurately give predictions at every station, the distinction between a live and scheduled display is not really that significant.
To give a little more visual flair, I added a little jitter for the train arrival times so that the pattern is not always the same.
I also decided to embed the script for a small WiFi hotspot when it loses the time on the on-board clock. When you first power it up, it will wait for someone to connect and set the correct time and use that to set the on-board clock. I provisioned a way to set the time automatically via NTP, but I decided against it in the end because it doesn't add much to the effect.
Getting the data for the schedule
When I decided to go down the route of making a schedule, I had to actually find a way to obtain and store the schedule.
Schedule
Happily enough, CTA provides the train scheduled arrival times as in a GTFS format. This is a standard format for public transit provided for consumption by the Google Maps API.
Cleaning up the data
Because I was only interested in certain aspects of this data, I first needed to clean it up by removing unnecessary columns. Most of this was done in Pandas.
Transforming Stop to Map locations
The schedule in the GTFS file only indicates the stop locations. The City of Chicago provides an API that includes which map location each stop belongs to.
- Stop Location - A stop is used to describe the train's direction and line. Multiple stops can exist at a map location because it can either be a interchange station, or it can indicate different directions of a train at the same map location.
- Map Location - A physical station.
Merging these two sets of data, I mapped every stop to every map location, and then processed the schedule to change all the stop locations to map locations so that the LED would light up whenever a train enters the station from either direction.
Timings that go beyond 23:59
Because the GTFS specs allow for timings like 25:00 to indicate that the same service is running into the next day (01:00), I needed to process all the timings to ensure that they wrap around at 23:59 because I didn't need this additional information and I wanted to keep the length of each 'day' in the schedule to 24 hours.
Stations that don't exist as a map location
The schedule also includes some stops that don't exist on the CTA line, for example, there is an entry for "Old Orchard", but no CTA line for that exists, and the only reference I could find to it was a cancelled extension on the Yellow line in 2009.
This was easy to process. If the stop doesn't exist (no map location), then it is ignored during the merging process.
Processing the Schedule
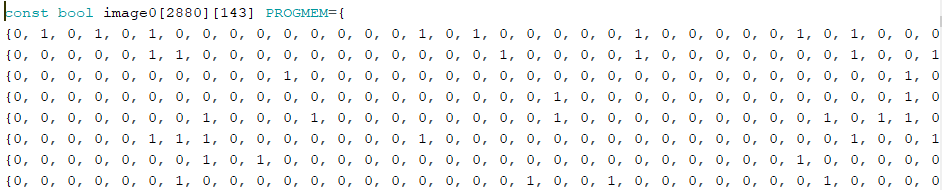
In order for the microcontroller to consume the schedule easily (the schedule file is 171MB), I decided that the trains at each stop at any given point in time can be represented as a boolean list, sorted by the map id of each location. I noticed that the stop arrival times were broken up into 30 second segments, so I only had to have 24 hours x 60 minutes x 2 x 30 second chunks = 2880 boolean characters per station.
I stored this in memory as a 2D array, and that still took up 3Mbit. This is still a lot for a microcontroller where 4Mbit feels luxurious.
Electronics
Main IC
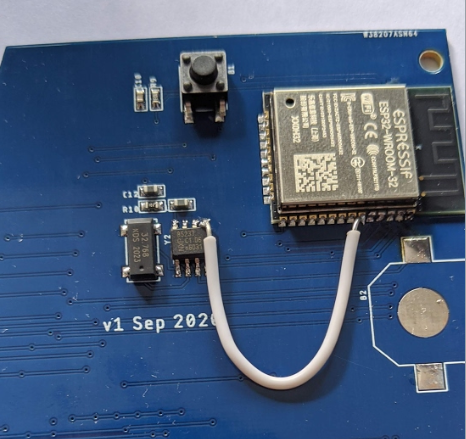
I decided to use a ESP32 module because it had sufficient memory to store the schedule, and it also provides WiFi and Bluetooth options. The wireless option is useful if I ever want to switch to using a live display, and it also provides a user-configurable interface that can be easily accessed by having the ESP32 act as an access point.
LED
Lighting up 127 LEDs independently is no trivial matter. I was looking into a charlieplexed design, but that would require 12 pins at minimum, and each pin had to supply a considerable amount of current to drive all the LEDs. I wasn't too enthusiastic about this idea. Another idea was to use a I2C multiplexer to drive each LED directly, but that too would require at least 8 multiplexers, and I didn't like the idea of having to solder so many multiplexers
Happily enough I remembered that I had salvaged a Charlieplexed driver (IS31FL3731) and a LED shield from years before that I never really found a use for. Turns out it was just waiting for this project to happen. Having these modules on hand made it really simple to prototype as I only needed create an I$^2$C connection to start driving the display.
Most of the testing occurred on this breadboard prototype. While there was no pattern I could discern, I visually acertained that it was working correctly by observing the general state of the LEDs as the 'day' progressed.
PCB
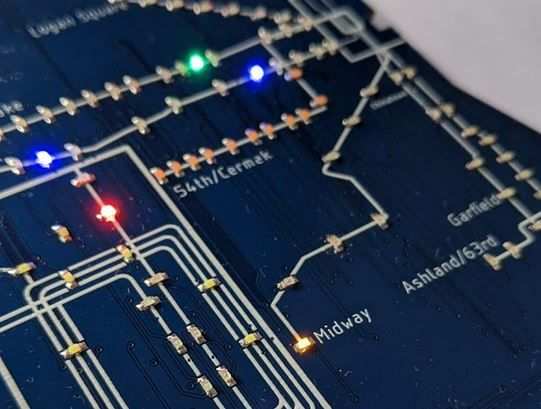
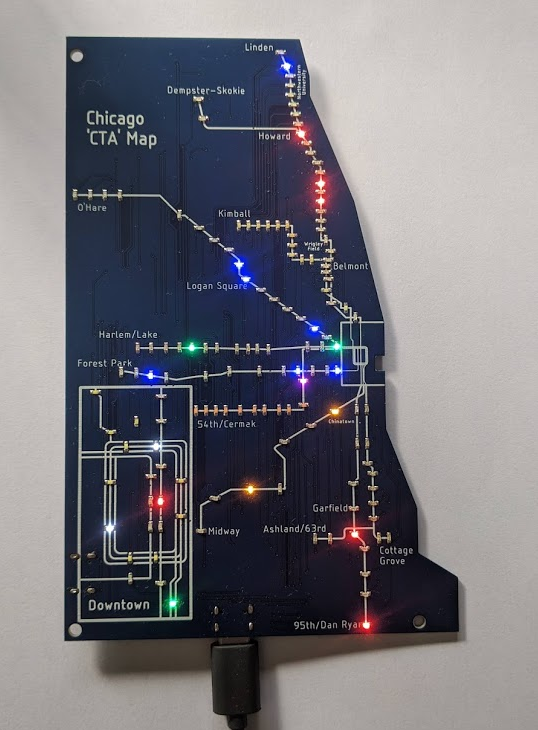
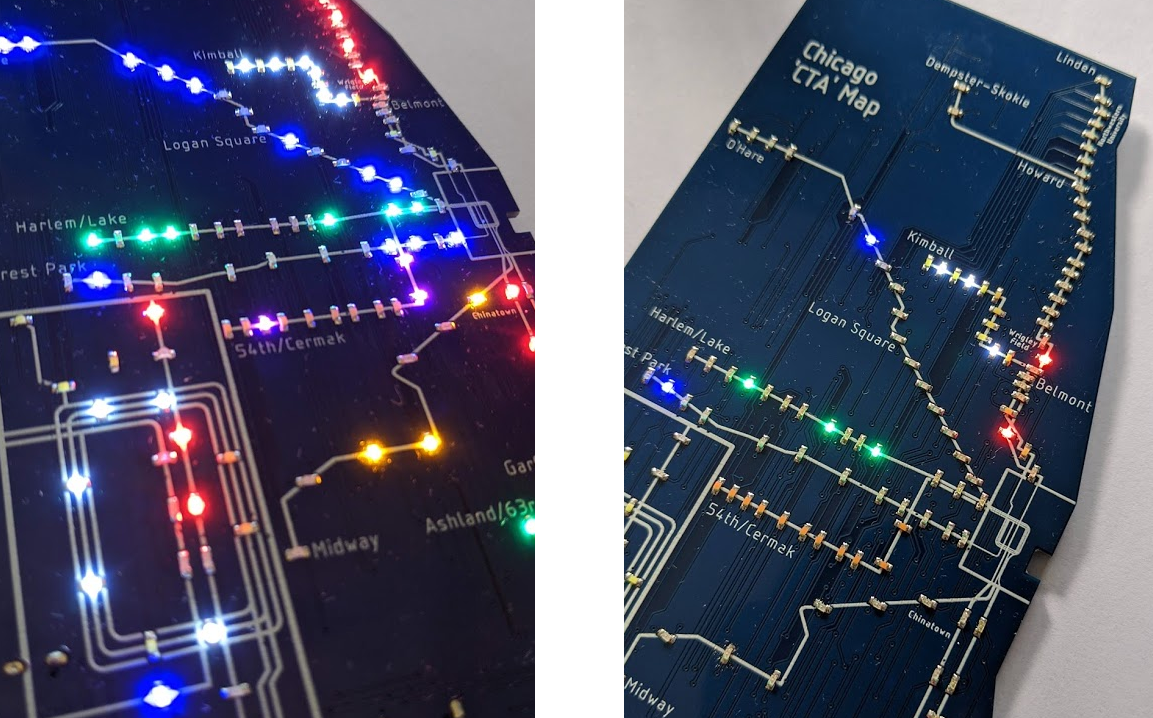
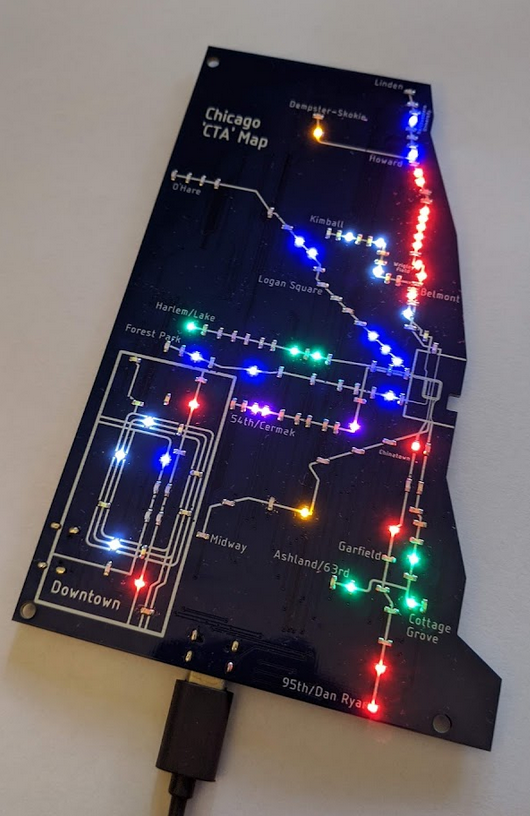
Once I had the code working, I designed a PCB. The layout is meant to represent the train map as closely as possible, even attempting to recreate the profile of Michigan Lake.
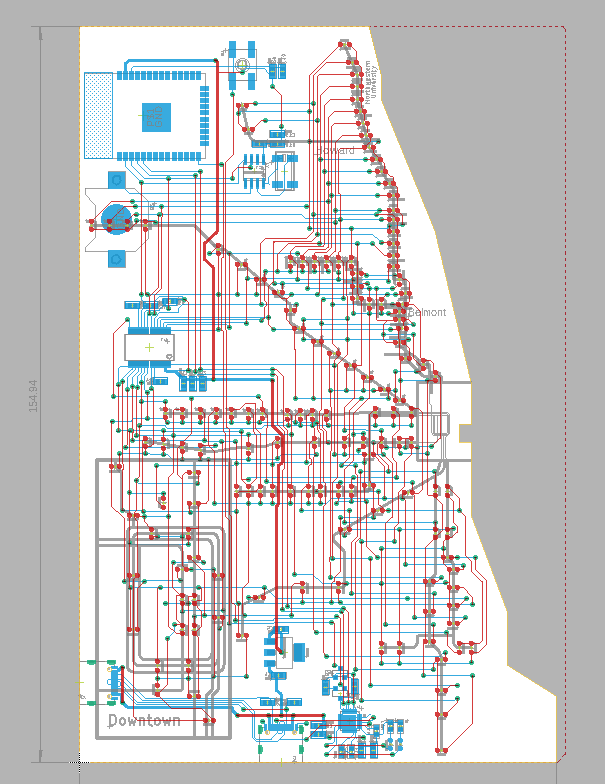
The Manhattan layout style really saved lots of difficult decisions for me. Plus, it looks really neat. I used the general shape of Chicago as well as the CTA line but I took a little bit of artistic license to make it more visually interesting. I also included 2 USB-C ports at two angles to allow the piece to be plugged in from either the bottom or the side.
Stencils
Soldering all of this would be a real pain to do by hand, so I bought a stencil with the PCBs.
The stencil made soldering incredibly easy. I usually spend an hour troubleshooting CP2104 USB-UART ICs, which are QFN-24 parts, (no leads, closely packed pads) but this time, it just worked on the first go!
The surface was also much cleaner as I didn't need to use a lot of flux, nor were there tiny balls of solder on the surface, which is normal if you are dispensing the solder paste by hand.
Soldering Day
Everything came! Well almost everything. I discovered that I had forgotten to add the LDO IC to my purchase so I had to substitute it with another IC I had lying around. It pays to have spares around. It is not often, but I'm grateful when it does.
Mistakes
The main mistake I faced was that I connected SDA of the ESP32 to the wrong pin. Luckily, this was easily fixed by jumping the actual SDA pin to the pad that was connected to the wrong pin. I discovered this when neither of my I$^2$C chips were responding.
I didn't solder down the legs of USB-C connector, and it broke off when I was trying to connect the board to a USB-C wire. It took off a few important pads, but luckily I had put two USB-C ports on the board.
Mapping the stations
This was probably the most time consuming part of the whole process. The data for each arrival period is organized by increasing station numbers: 40010 (Austin), 40020 (Harlem) , 40030 (Pulaski) ... However, these station numbers are completely random and don't correspond to any order that I could discern.
In order to ensure that the right station lights up, I had to map these station numbers to the LEDs on the board: Austin (40010, LED 43), Harlem (40020, LED 39)... Thus began the slow process of iterating through all the station numbers, finding the location of each stop, and finding the corresponding LED on the board, and recording it in a table.
All 144 of the LEDs.
It was long and tedious, but it was worth it.
Result
The result is spectacular. I really love the pink LEDs in particular. I'm also pleased to report that the recipient of the board really likes it!
Limitations of this type of display
- Detailed information about train timings is not available. However, for that you can use one of the many hundreds of train apps out there.
- You can't track individual trains. Trains appear to 'teleport' between stations because of the timings of their arrivals. If you keep the LEDs on until the train leaves, then you have another problem of the LEDs being on all the time for busy stations, which makes for a visually uninteresting display.
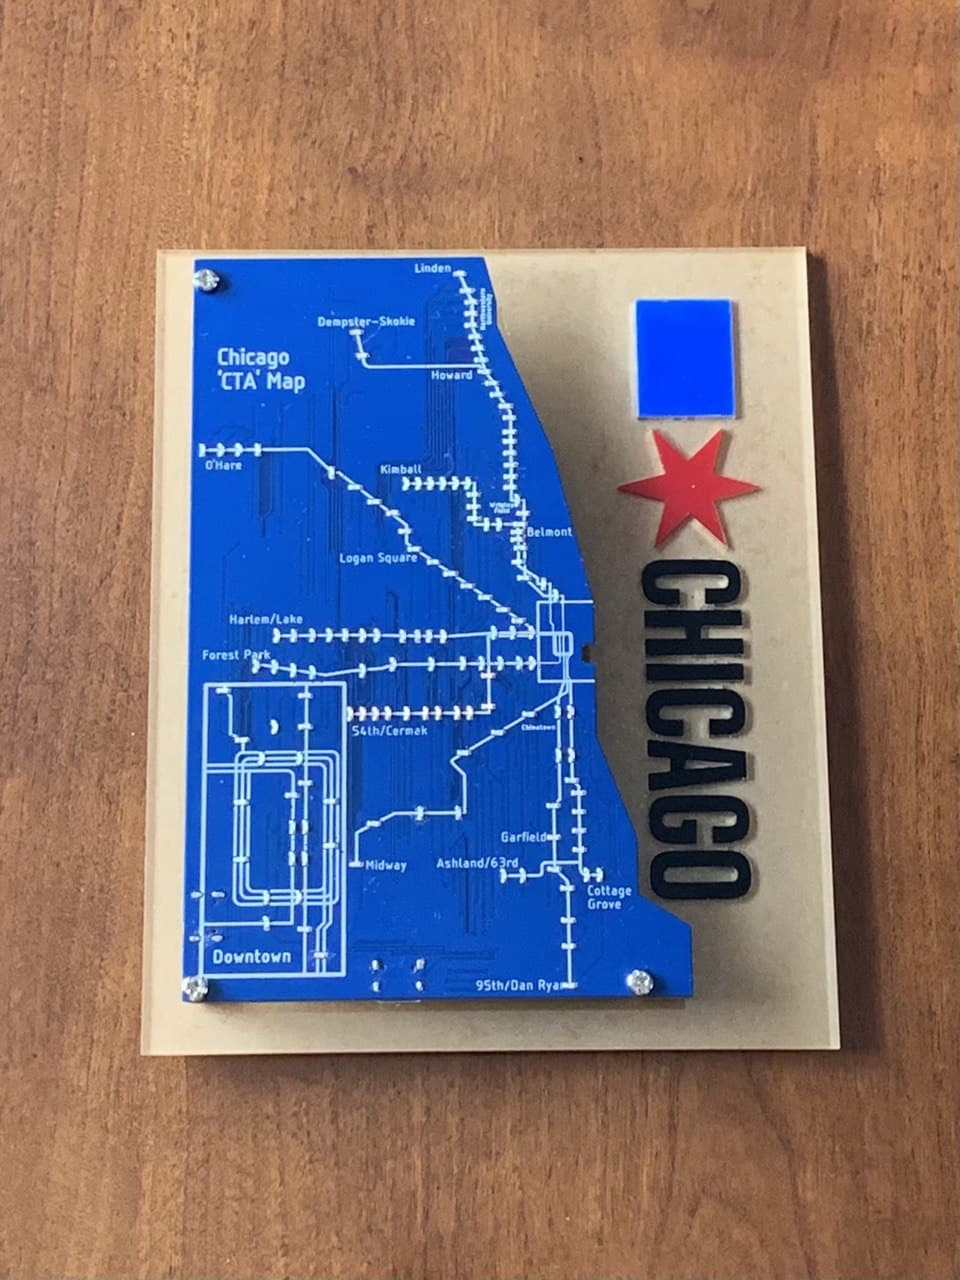
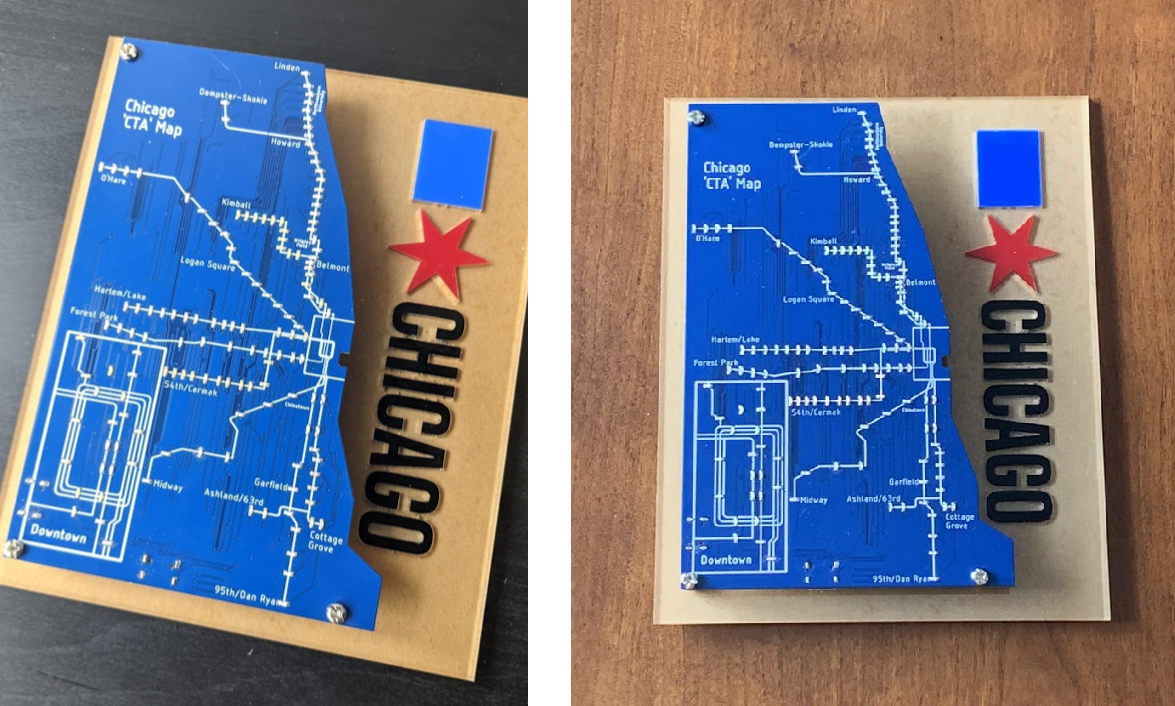
The acrylic backing is made from four different pieces of acrylic. A negative of Chicago's current logo is cut in the transparent acrylic. The pattern is adjusted to account for the laser kerf, and it is cut from colored pieces of acrylic to be press-fit into the transparent acrylic.
The transparent acrylic really allows the colored pieces of acrylic to pop, and I left the backing on because I like the look, which is vaguely reminicient of clear water on sand.
Thoughts
It was really fun to build this. Figuring out how all the electrical, software, and mechanical components were going to come together was tough but I learned a lot. Seeing everything come together and it working was definitely the most satisfying part however.